
 Account


Key takeaways
- Between 22 September and 24 October 2026 (32 days), the median change across 3,237 matched SSD prices in this report was 0.0%: 1,058 rose, 883 fell and 1,296 were unchanged. Each price is one part number in one condition.
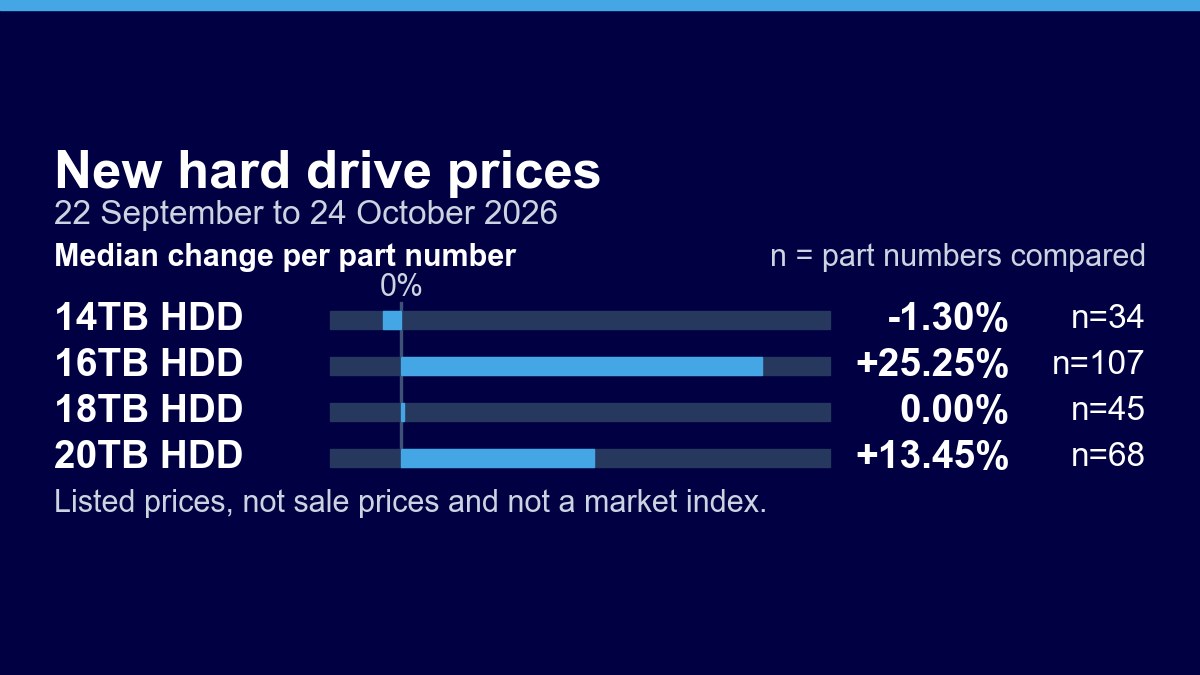
- New 16TB hard drives: 72 of 107 matched part numbers rose between 22 September and 24 October 2026, a median change of +25.25%.
- New 20TB hard drives: 55 of 68 matched part numbers rose over the same dates, a median change of +13.45%.
- On 24 October 2026, the new SSD median per TB in our catalog was 2.23 times the refurbished median at 1.92TB and 2.95 times at 3.84TB, but 1.20 times at 15.36TB.
- On the same date, the new 15.36TB SSD median was $473.60 per TB, against $832.73 per TB for new 1.92TB SSDs.
Short version: between 22 September and 24 October 2026, the typical SSD in this report did not change price, and neither did the typical hard drive at 14TB to 20TB. New 16TB and new 20TB hard drives are the exception: most of their part numbers rose. All prices here are our listed prices, recorded daily, not sale prices and not a market index.
The same part numbers, 22 September to 24 October 2026
We compared every part number in this report that had a price on both 22 September 2026 and 24 October 2026, in its listing's own condition. For SSDs that is 3,237 prices: 1,058 rose, 883 fell and 1,296 were unchanged, a median change of 0.0%. For hard drives it is 359 prices: 171 rose, 61 fell and 127 were unchanged, a median change of 0.0%. Individual prices still moved: 605 SSD prices rose by more than 10% and 453 fell by more than 10%. For hard drives, 136 rose by more than 10% and 17 fell by more than 10%.
| Drive | Condition | Part numbers compared | Rose | Fell | Unchanged | Median change per part number |
|---|---|---|---|---|---|---|
| 960GB SSD | Refurbished | 490 | 209 | 138 | 143 | 0.00% |
| 960GB SSD | New | 318 | 93 | 49 | 176 | 0.00% |
| 1.92TB SSD | Refurbished | 594 | 109 | 192 | 293 | 0.00% |
| 1.92TB SSD | New | 380 | 122 | 96 | 162 | 0.00% |
| 3.84TB SSD | Refurbished | 557 | 112 | 213 | 232 | 0.00% |
| 3.84TB SSD | New | 403 | 218 | 56 | 129 | +2.60% |
| 7.68TB SSD | Refurbished | 241 | 76 | 69 | 96 | 0.00% |
| 7.68TB SSD | New | 169 | 80 | 46 | 43 | 0.00% |
| 15.36TB SSD | Refurbished | 48 | 21 | 16 | 11 | 0.00% |
| 15.36TB SSD | New | 27 | 14 | 5 | 8 | +8.19% |
| 30.72TB SSD | New | 6 | 4 | 2 | 0 | +2.61% |
| 14TB HDD | Refurbished | 32 | 18 | 5 | 9 | +3.70% |
| 14TB HDD | New | 34 | 5 | 21 | 8 | -1.30% |
| 16TB HDD | Refurbished | 23 | 14 | 2 | 7 | +6.67% |
| 16TB HDD | New | 107 | 72 | 10 | 25 | +25.25% |
| 18TB HDD | Refurbished | 49 | 5 | 6 | 38 | 0.00% |
| 18TB HDD | New | 45 | 1 | 8 | 36 | 0.00% |
| 20TB HDD | New | 68 | 55 | 9 | 4 | +13.45% |
New 16TB and new 20TB hard drives are where prices rose. 72 of 107 new 16TB part numbers rose, for a median change of +25.25%, and 55 of 68 new 20TB part numbers rose, for +13.45%. New 18TB part numbers held: 36 of 45 were unchanged. A row needs at least 5 part numbers compared, so refurbished 30.72TB SSD (4) and refurbished 20TB HDD (1) are left out.
Median listed price per TB, 24 October 2026
This table takes each part number that shows a price on this site today, prices it at its listed price of 24 October 2026 in its listing's own condition, and divides by its capacity. A median per TB lets you compare capacities, but it is a median of listed prices, not a quote.
| Drive | Refurbished, median per TB | Refurbished part numbers | New, median per TB | New part numbers | New against refurbished |
|---|---|---|---|---|---|
| 960GB SSD | $551.72 | 586 | $1,270.50 | 362 | +130.3% |
| 1.92TB SSD | $373.31 | 660 | $832.73 | 423 | +123.1% |
| 3.84TB SSD | $273.28 | 619 | $805.66 | 423 | +194.8% |
| 7.68TB SSD | $381.56 | 255 | $748.69 | 202 | +96.2% |
| 15.36TB SSD | $393.81 | 53 | $473.60 | 29 | +20.3% |
| 30.72TB SSD | $238.73 | 7 | $652.99 | 8 | +173.5% |
| 14TB HDD | $48.79 | 34 | $74.96 | 48 | +53.6% |
| 16TB HDD | $38.05 | 28 | $90.21 | 113 | +137.1% |
| 18TB HDD | $78.65 | 52 | $108.46 | 48 | +37.9% |
| 20TB HDD | Under 5 part numbers | 4 | $78.46 | 72 | Not shown |
Per drive, the medians on the same date were $1,598.85 new and $716.76 refurbished for a 1.92TB SSD, $5,749.92 new and $2,930.40 refurbished for a 7.68TB SSD, and $1,443.42 new and $608.85 refurbished for a 16TB hard drive. A cell needs at least 5 part numbers with a price, so refurbished 20TB HDD (4) is not shown.
New against refurbished
The last column gives how far the new median per TB sits above the refurbished median at the same capacity. For SSDs the gap was widest at 3.84TB, where the new median was 2.95 times the refurbished one, and narrowest at 15.36TB, at 1.20 times. For hard drives it was 2.37 times at 16TB and 1.38 times at 18TB. Each listing states its condition, and new and refurbished prices are tracked separately on every price page.
What to do if you are buying this quarter
- Check the price on the day and ask for a dated quote. Prices in this report are as listed on 24 October 2026. For more than a few drives, send a quote request with part numbers and counts.
- Compare price per TB across capacities, not only the price per drive. In this report, new 15.36TB SSDs had a lower median per TB than new 1.92TB SSDs.
- For new 16TB and 20TB hard drives, compare before you buy: most of their part numbers rose between 22 September and 24 October 2026.
- Check each listing's interface, form factor and condition against your system's own documentation.
Price history by capacity: 1.92TB SSD, 3.84TB SSD, 7.68TB SSD, 15.36TB SSD, 16TB HDD, 18TB HDD and 20TB HDD. Browse by capacity: 960GB SSD, 1.92TB SSD, 3.84TB SSD, 7.68TB SSD, 15.36TB SSD, 14TB HDD, 16TB HDD, 18TB HDD, 20TB HDD. Memory prices: Server memory prices, October 2026.
Method: active Memory Clearance listings with a price shown online, in the Solid State Drives category with a parsed interface of SAS, SATA or NVMe, or in the Server Hard Drives category with SAS or SATA, at a parsed capacity of 960GB, 1.92TB, 3.84TB, 7.68TB, 15.36TB or 30.72TB (SSD) or 14TB, 16TB, 18TB or 20TB (hard drive). Restricted brands and hidden duplicate listings are left out. Each part number takes its listed price in its listing's own condition, new or refurbished: the per TB table uses prices listed on 24 October 2026, and the comparison uses part numbers with a price on both 22 September 2026 and 24 October 2026. We recorded listed prices on 27 days in that window. A change within half a percent counts as unchanged. A table cell or row needs at least 5 part numbers. These are listed prices, not sale prices and not a market index.